Analyze your usage data: Accxia LogViewer
Logviewer Jira and JSM - example video
Logviewer Confluence - example video
Download
Please download the Accxia LogViewer from the following location: Accxia App Store or install it from the Atlassian Marketplace
Requirements
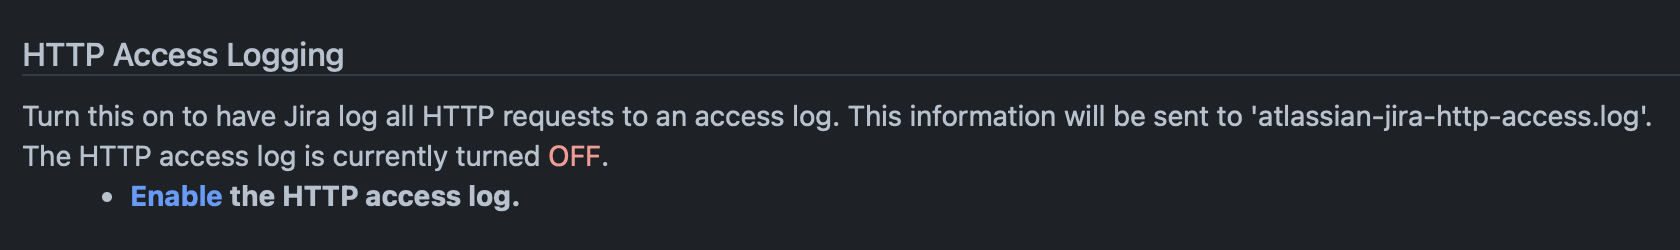
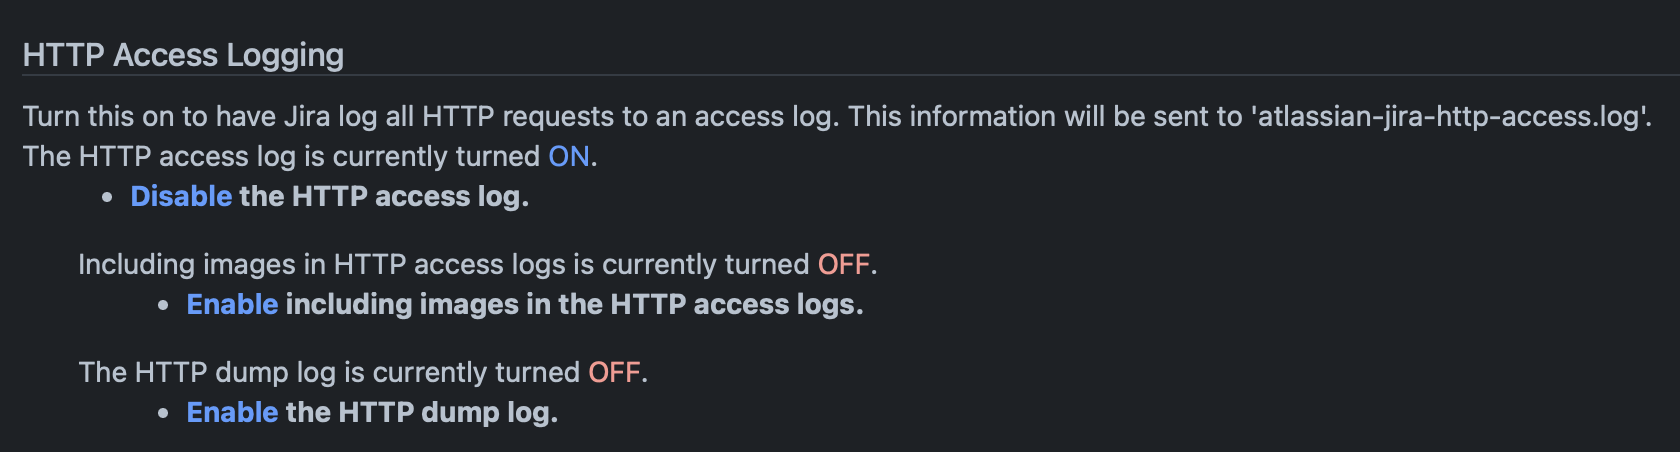
To use our Logviewer and to get the desired results it is necessary to switch on http logging and collect data for a few days in case http logging is switched off.
To enable http logging go to your Jira system → System → Loggin and Profiling and switch on the option HTTP Access Logging:
Installation
The logviewer is a simple administration plugin without changing anything in your JIra installation it is purely for showing data.
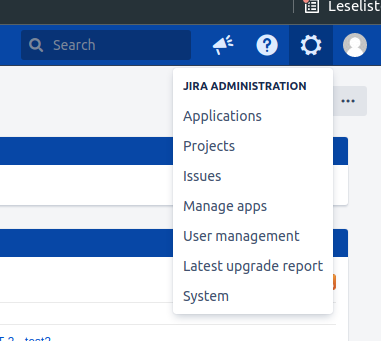
To install the addon, login with administrator privileges and go to the Jira / Confluence settings and Manage Apps.
Click on "Upload App"

Choose the downloaded .jar file and click on upload
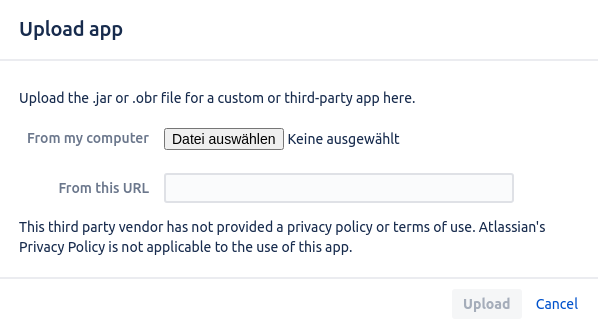
The installation is done. A license key is not needed for the LogViewer
Create your Userpeak for Jira
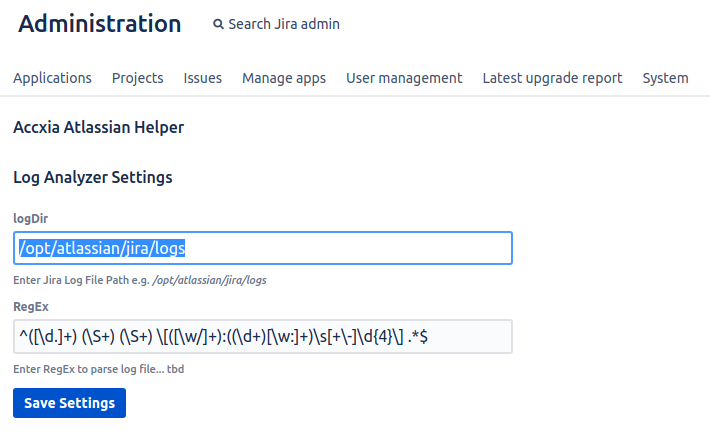
To create your logfile or userpeak open the LogView Config or enter the following URL:
http(s)://your-jira-instance-url/plugins/servlet/mainviewer
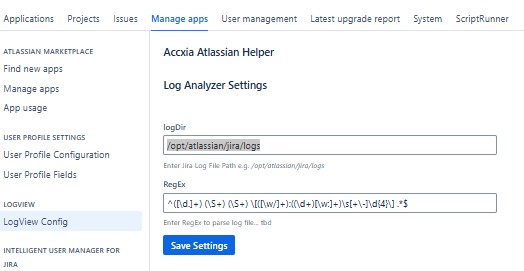
- Enter the correct "logDir". If Jira is installed in the default path all "access.log-file" are in the application directory in "/opt/atlassian/jira/logs". Enter the correct path and click on "Save Settings"
- Attention! Please do not change anything in the default "RegEx" this regular expression is setup to analyse the Jira-Access-Logfiles!
- If there are any problems with the RegEx, please ask us
The easiest way is to tell us the following entry from the server.xml
- Choose the amount of Logfiles you would like to analyse. The relevant logfiles are all access_log.2021xxxxxx. You can choose all the dates from the period you would like to analyse.
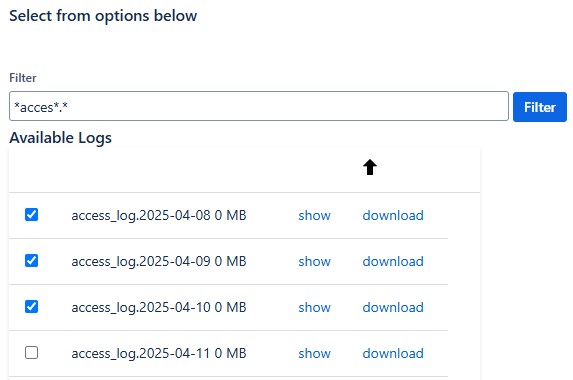
- Click on "Analyse" and wait until the choosen logfiles have been listed in the result-field.
If an analysis has already been carried out, first click on reset (button below)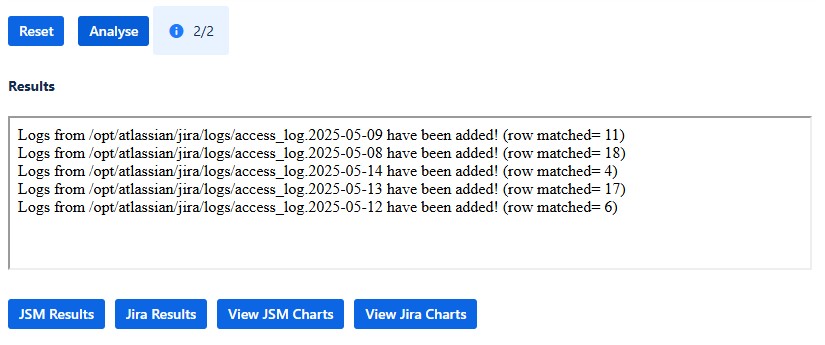
- Behind the analysis field it is shown whether the data from all nodes has been analyzed.
(If the analysis stops at 0/2 for example, please contact us to adjust the regex key)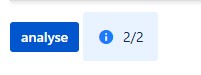
- The user peak can be viewed directly in Jira using the View JSM or Jira Chart buttons. A PDF can be downloaded from the chart view.
The respective CSV files can be downloaded using the JSM or Jira Results buttons.
From these, the user peak can be determined using Excel.
-> goto Working with your generated results.csv
Create your Userpeak for Confluence
To create your logfile or userpeak open the LogView Config or enter the following URL:
http(s)://your-confluence-instance-url/plugins/servlet/mainviewer
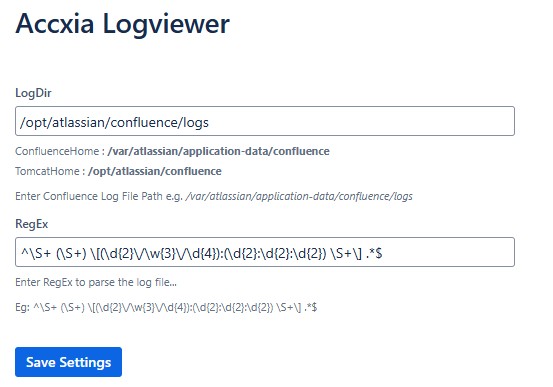
- Enter the correct "logDir". If Confluence is installed in the default path all "confluence_access.log-file" are in the application directory in "/opt/atlassian/confluence/logs". Enter the correct path and click on "Save Settings"
- Attention! Please do not change anything in the default "RegEx" this regular expression is setup to analyse the Confluence-Access-Logfiles!
- If there are any problems with the RegEx, please ask us
The easiest way is to tell us the following entry from the server.xml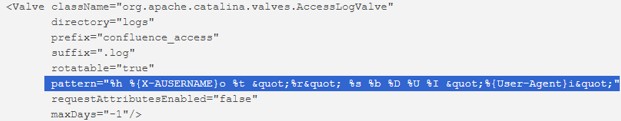
- Choose the amount of Logfiles you would like to analyse. The relevant logfiles are all confluence_access_log.2025xxxxxx. You can choose all the dates from the period you would like to analyse.
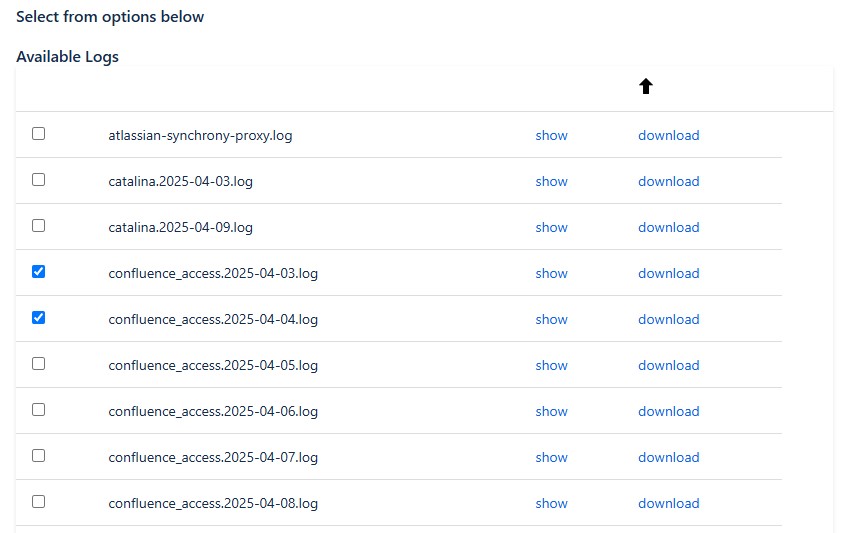
- Click on "Analyse" and wait until the choosen logfiles have been listed in the result-field.
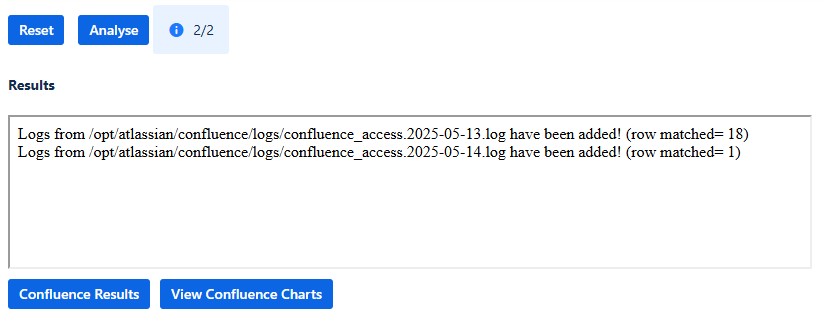
- Behind the analysis field it is shown whether the data from all nodes has been analyzed.
(If the analysis stops at 0/2 for example, please contact us to adjust the regex key) - The user peak can be viewed directly in Confluence using the View Charts buttons. A PDF can be downloaded from the chart view.
The csv files can be downloaded using the results button.
From these, the user peak can be determined using Excel.
-> goto Working with your generated results.csv
Working with your generated results.csv
Instructions for manual creation with Excel:
To evaluate your results.csv an import into Microsoft Excel (only works with Microsoft Office for Windows, not with Microsoft Office for Mac) is necessary. Just opening the csv-file in Excel will not work. It needs to be imported!